Prometheus Metrics Configuration Guide
Seata supports enabling Metrics data collection in TC and outputting it to the Prometheus monitoring system.
Configure Metrics in TC
Step 1: Open the Metrics configuration in TC
Seata Server already includes the metrics (seata-metrics-all) dependency, but it is disabled by default. You need to enable the collection configuration for metrics.
seata:
  metrics:
    enabled: true
    registry-type: compact
    exporter-list: prometheus
    exporter-prometheus-port: 9898
Enter http://tc-server-ip:9898/metrics to obtain the latest Metrics data, for example:
# HELP seata seata
# TYPE seata untyped
seata_transaction{meter="counter",role="tc",status="committed",} 1358.0 1551946035372
seata_transaction{meter="counter",role="tc",status="active",} 0.0 1551946035372
seata_transaction{meter="summary",role="tc",statistic="count",status="committed",} 6.0 1551946035372
seata_transaction{meter="summary",role="tc",statistic="total",status="committed",} 6.0 1551946035372
seata_transaction{meter="summary",role="tc",statistic="tps",status="committed",} 1.6163793103448276 1551946035372
seata_transaction{meter="timer",role="tc",statistic="count",status="committed",} 6.0 1551946035372
seata_transaction{meter="timer",role="tc",statistic="total",status="committed",} 910.0 1551946035372
seata_transaction{meter="timer",role="tc",statistic="max",status="committed",} 164.0 1551946035372
seata_transaction{meter="timer",role="tc",statistic="average",status="committed",} 151.66666666666666 1551946035372
Obtaining similar data as above proves that the metric is successfully enabled.
Note:
- If certain transaction statuses, such as rollback, do not occur, the corresponding metric indicators will not exist (output).
Step 2: Modify the Prometheus configuration file and start Prometheus
Open the Prometheus configuration file prometheus.yml and add a scrape configuration to fetch Seata TC's Metrics data:
scrape_configs:
  # The job name is added as a label `job=<job_name>` to any timeseries scraped from this config.
  - job_name: 'prometheus'

    # metrics_path defaults to '/metrics'
    # scheme defaults to 'http'.
static_configs:
- targets: ['localhost:9090']

- job_name: 'seata'

# metrics_path defaults to '/metrics'
# scheme defaults to 'http'.

static_configs:
- targets: ['tc-server-ip:9898']
Step 3: View Seata TC Metrics in Prometheus UI or Grafana
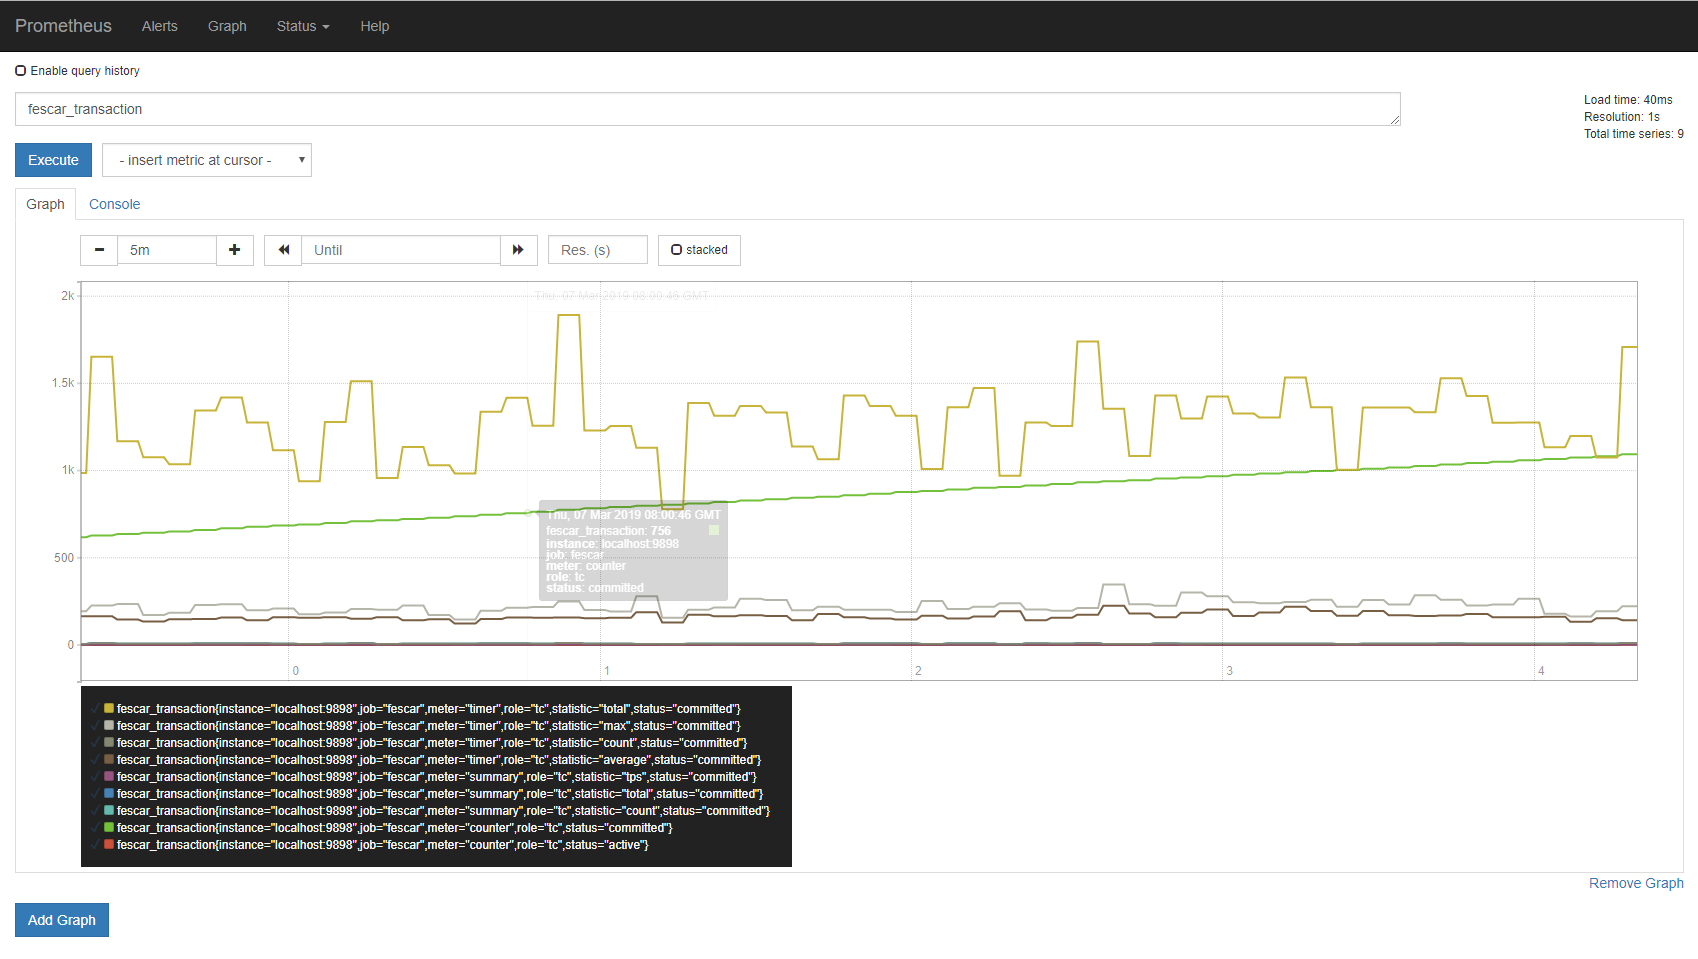
Open Prometheus UI http://localhost:9090/graph in a browser, select seata_transaction, and click on "Execute" to retrieve the latest data:
It is recommended to use Grafana in conjunction with Prometheus for better query results:
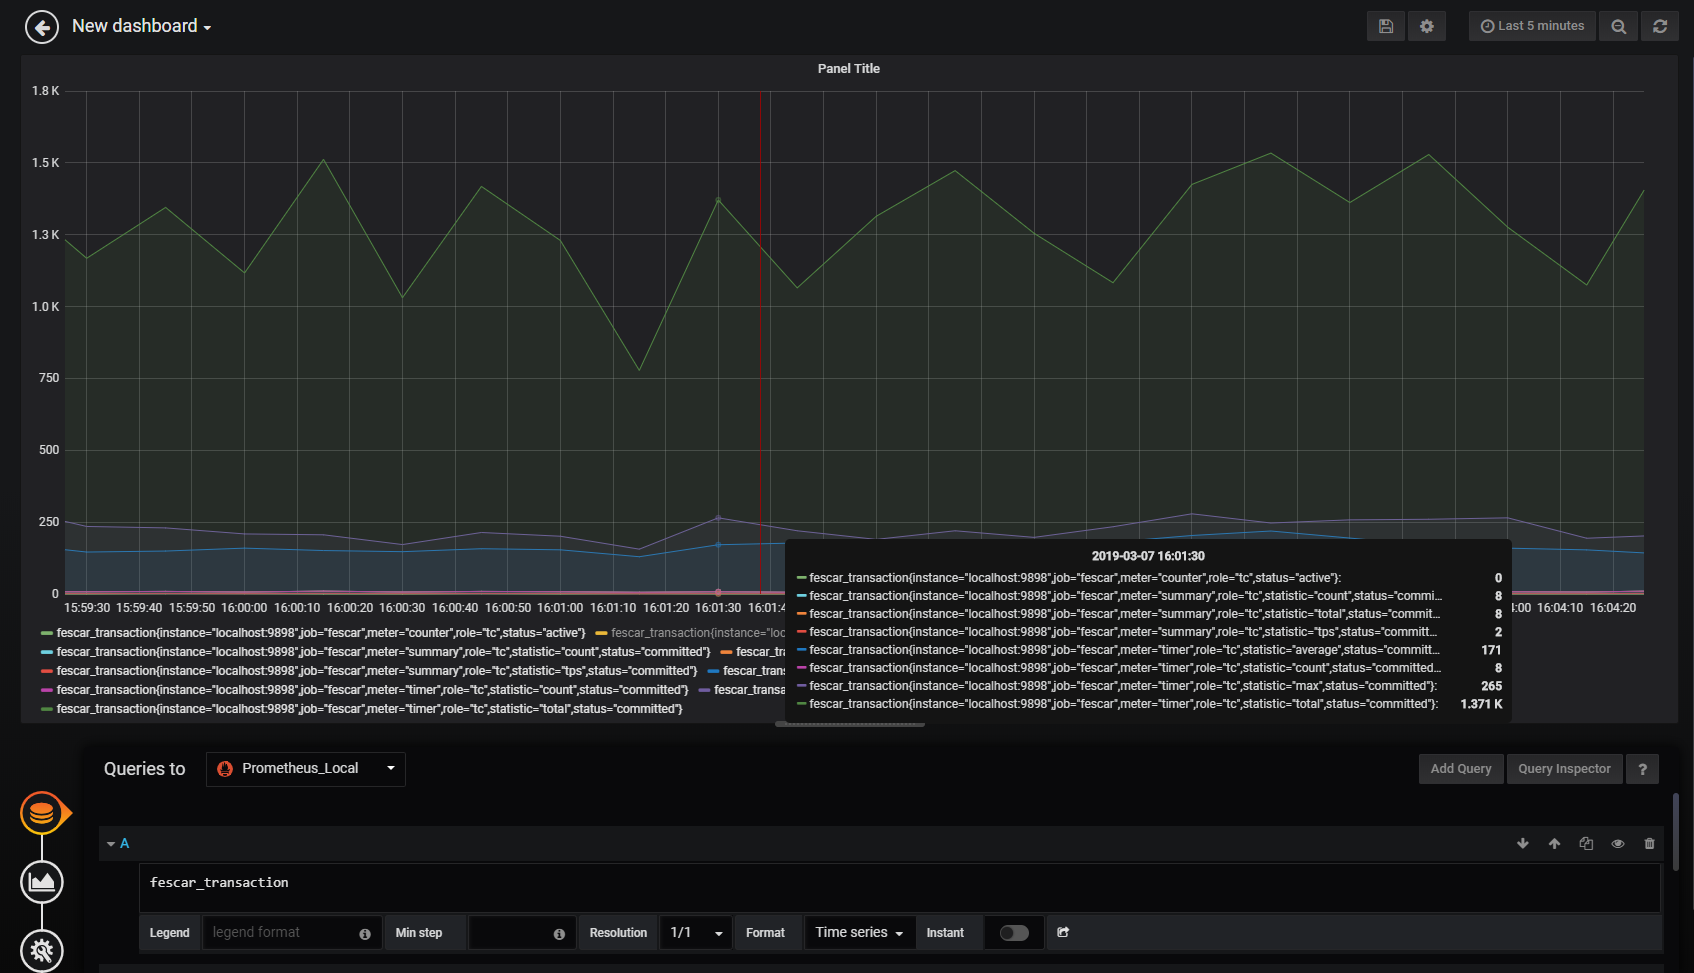
Note: This configuration sets Prometheus as the data source for Grafana, so the data is the same, but Grafana provides a better display effect.