Introduction to Seata
Seata is the predecessor of Alibaba Group's massively used middleware for ensuring consistency of distributed transactions, and Seata is its open source product, maintained by the community. Before introducing Seata, let's discuss with you some problematic scenarios that we often encounter in the course of our business development.
Business Scenarios
Our business in the development process, basically from a simple application, and gradually transitioned to a huge scale, complex business applications. These complex scenarios inevitably encounter distributed transaction management problems, Seata's emergence is to solve these distributed scenarios of transaction management problems. Introduce a few of the classic scenarios:
Scenario 1: distributed transactions in the scenario of split library and split table
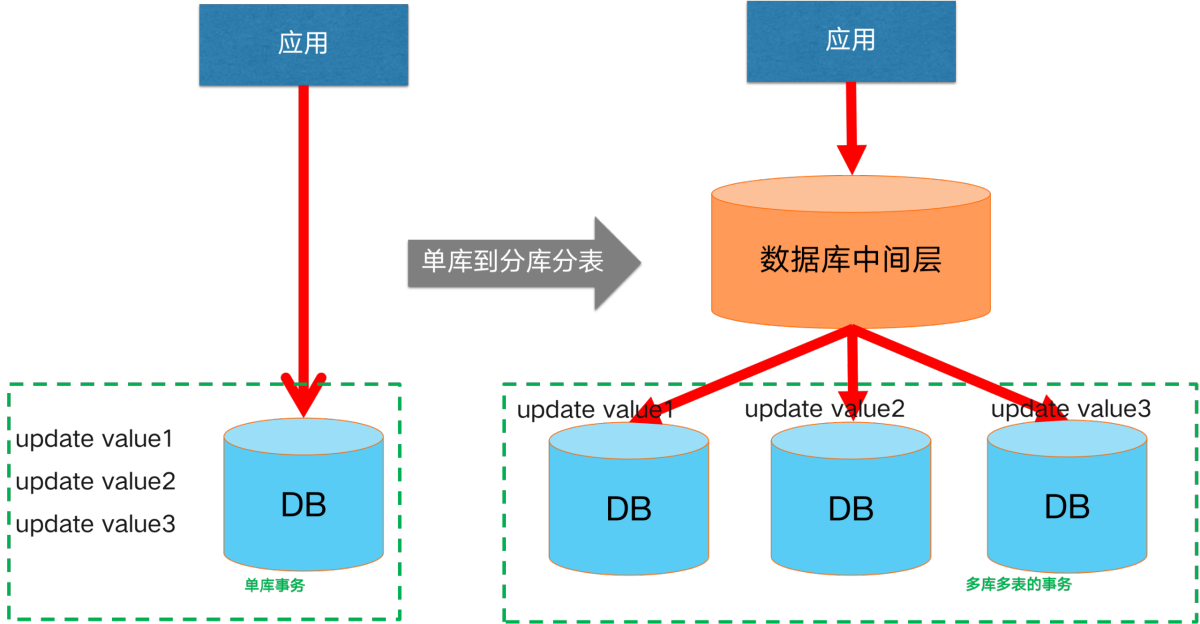 Initially, our business was small and lightweight, and a single database was able to secure our data links. However, as the business scale continues to grow and the business continues to become more complex, usually a single database encounters bottlenecks in terms of capacity and performance. The usual solution is to evolve to a split-database, split-table architecture. At this point, that is, the introduction of **split library and split table scenario **distributed transaction scenarios.
Scenario 2: Distributed Transactions in a Cross-Service Scenario
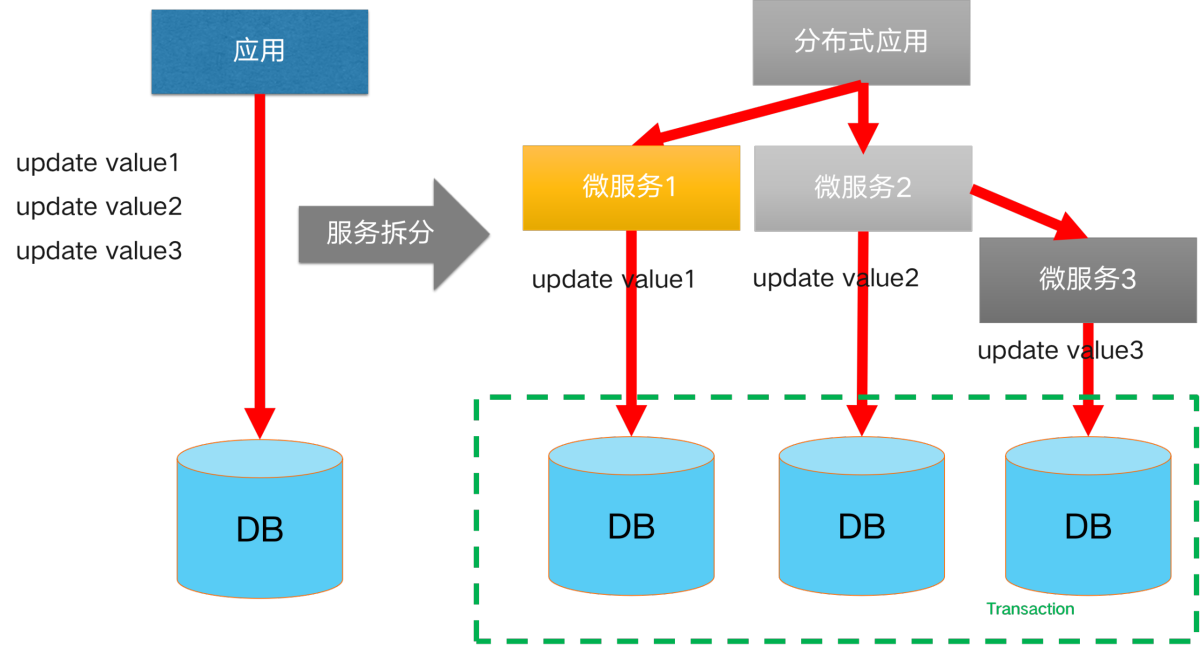 A solution to reduce the complexity of a monolithic application: application microservice splitting. After splitting, our product consists of multiple microservice components with different functions, each of which uses independent database resources. When it comes to data consistency scenarios involving cross-service calls, distributed transactions are introduced in cross-service scenarios.
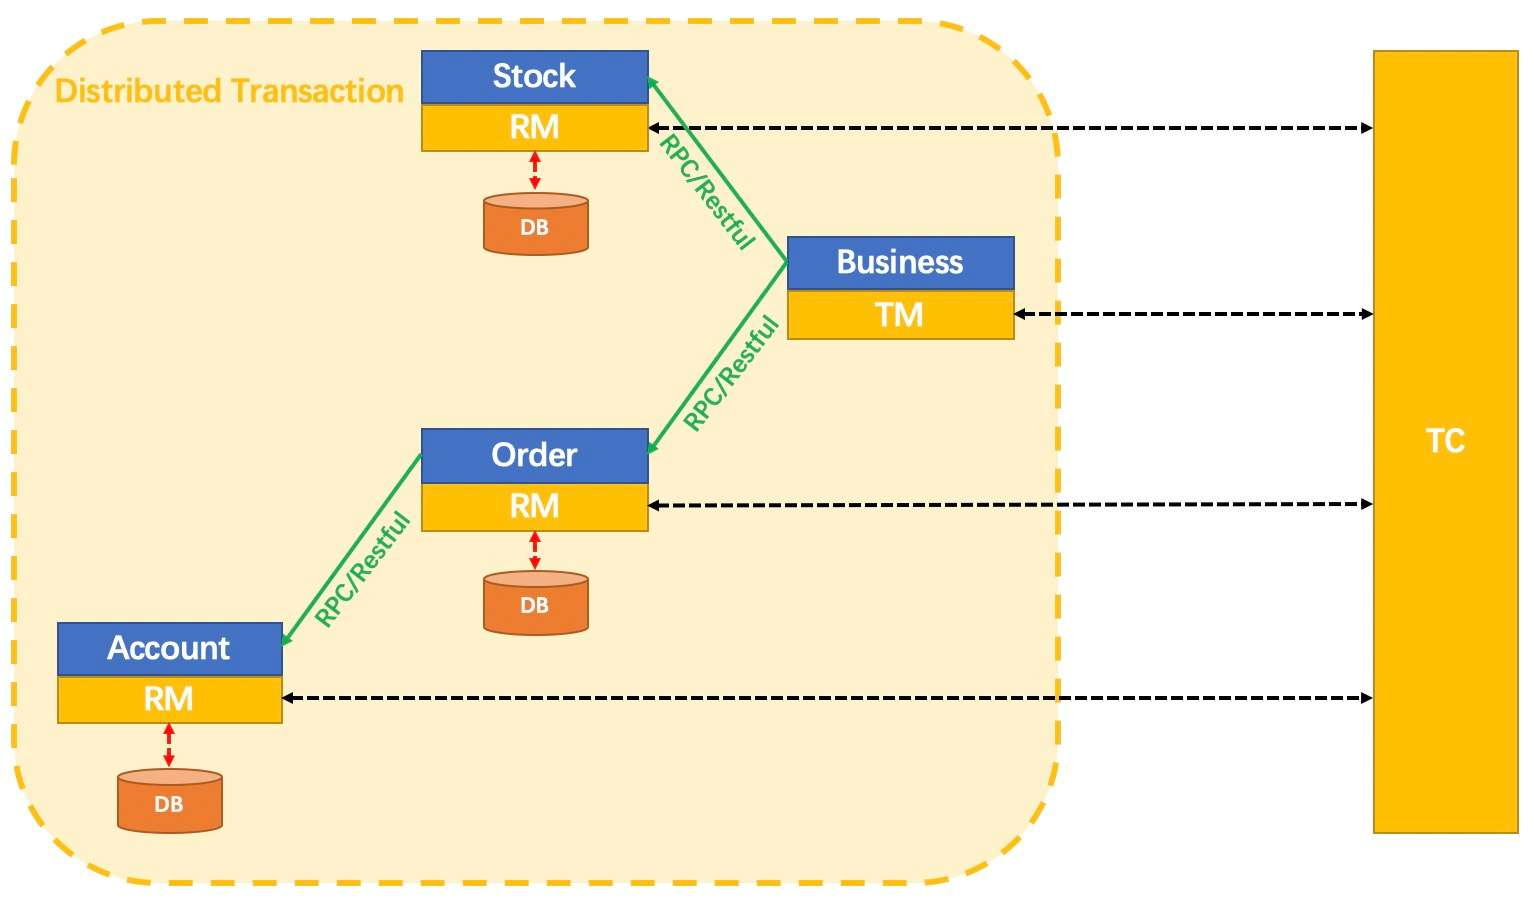
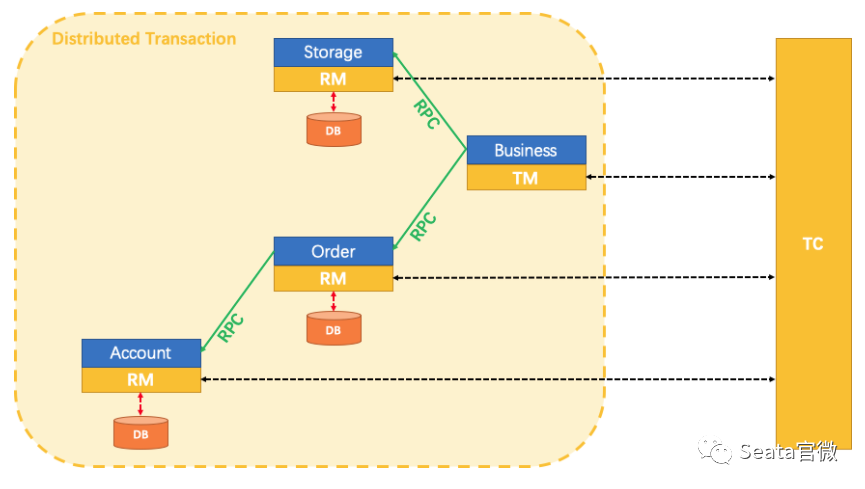
Seata architecture
 Its core components are mainly as follows:
- Transaction Coordinator (TC).
Transaction coordinator that maintains the running state of the global transaction and is responsible for coordinating and driving the commit or rollback of the global transaction.
- Transaction Manager (TM)
Controls global transaction boundaries, responsible for opening a global transaction and ultimately initiating a global commit or global rollback resolution, TM defines the boundaries of a global transaction.
- Resource Manager (RM)
Controls branch transactions and is responsible for branch registration, status reporting, and receiving commands from the Transaction Coordinator to drive the commit and rollback of branch (local) transactions.RM is responsible for defining the boundaries and behaviour of branch transactions.
Seata's observable practices
Why do we need observables?
- *# Distributed transaction message links are more complex *#
Seata, while solving these problems of user ease of use and distributed transaction consistency, requires multiple interactions between TC and TM, RM, especially when the links of microservices become complex, the interaction links of Seata will also increase in positive correlation. In this case, we actually need to introduce observable capabilities to observe and analyse things links.
- Anomalous links, hard to locate for troubleshooting, no way to optimise performance*
When troubleshooting Seata's abnormal transaction links, the traditional approach requires looking at logs, which is troublesome to retrieve. With the introduction of observable capabilities, it helps us to visually analyse links and quickly locate problems; providing a basis for optimising time-consuming transaction links.
- Visualisation, Data Quantification
The visualisation capability allows users to have an intuitive feeling of transaction execution; with quantifiable data, it helps users to assess resource consumption and plan budgets.
Overview of observable capabilities
| observable dimensions | seata desired capabilities | technology selection reference |
|---|---|---|
| Metrics | Functional dimensions: can be grouped and isolated by business, capture important metrics such as total number of transactions, elapsed time and so on. | |
| Performance level: high volume performance, plug-ins loaded on-demand. | ||
| Architecture: Reduce third-party dependency, server-side and client-side can adopt a unified architecture to reduce technical complexity. | ||
| Compatibility level: at least compatible with Prometheus ecosystem | Prometheus: industry-leading position in the field of metrics storage and query. | |
| OpenTelemetry: the de facto standard for observable data collection and specification. It does not store, display, or analyse the data itself | Tracing | Functionality level |
| Tracing | Functionality: Full-link tracing of distributed transaction lifecycle, reacting to distributed transaction execution performance consumption. | |
| Ease of use: simple and easy to access for users using seata | SkyWalking: using Java's Agent probe technology, high efficiency, simple and easy to use. | Logging |
| Logging | Functionality: logging all lifecycle information of the server and the client | |
| Ease of use: can quickly match global transactions to corresponding link logs based on XID | Alibaba Cloud Service | |
| ELK | Alibaba Cloud Service |
Metrics dimension
Design Ideas
- Seata as an integrated data consistency framework, the Metrics module will use as few third-party dependencies as possible to reduce the risk of conflicts.
- the Metrics module will strive for higher metrics performance and lower resource overhead to minimise the side effects of turning it on.
- When configured, whether Metrics is activated and how the data is published depends on the corresponding configuration; if the configuration is turned on, Metrics is automatically activated and the metrics data will be published via prometheusexporter by default.
- do not use Spring, use SPI (Service Provider Interface) to load extensions
module design
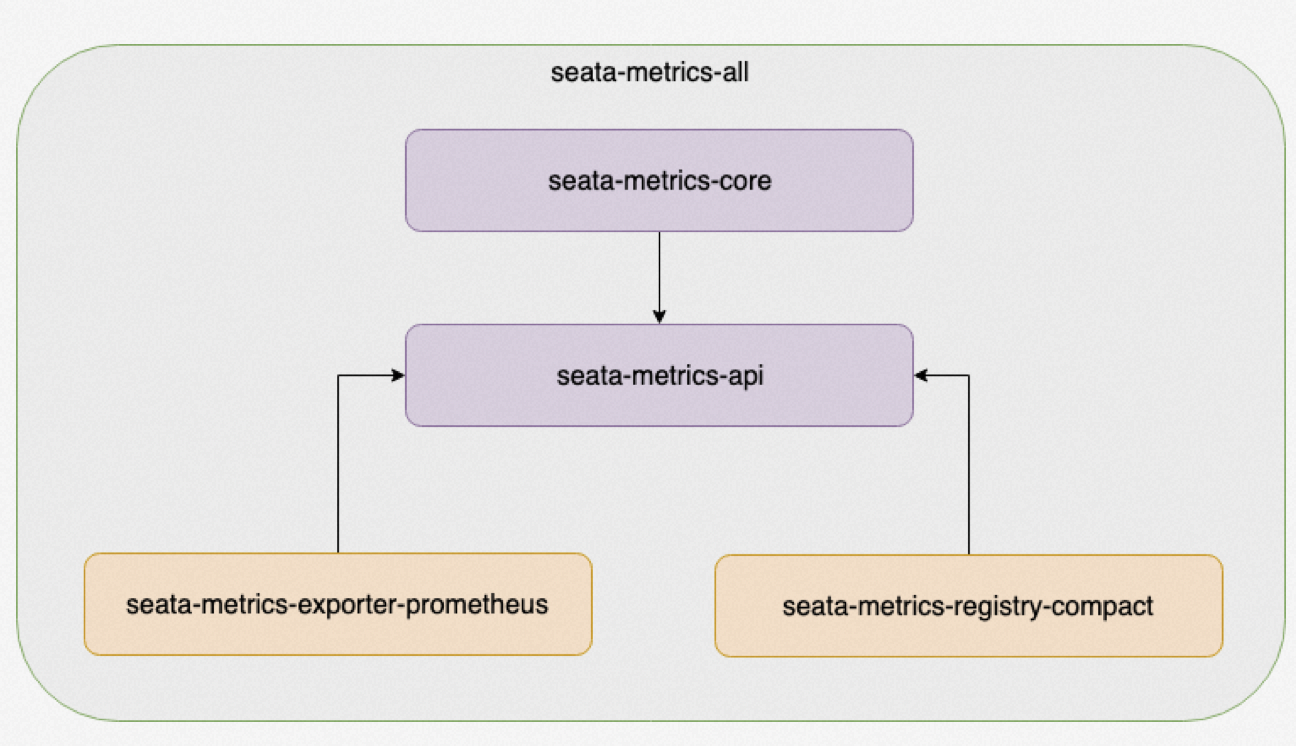
- seata-metrics-core: Metrics core module, organises (loads) 1 Registry and N Exporters according to configuration;
- seata-metrics-api: defines the Meter metrics interface, the Registry metrics registry interface;
- seata-metrics-exporter-prometheus: built-in implementation of prometheus-exporter;
- seata-metrics-registry-compact: built-in Registry implementation and lightweight implementation of Gauge, Counter, Summay, Timer metrics;
metrics module workflow
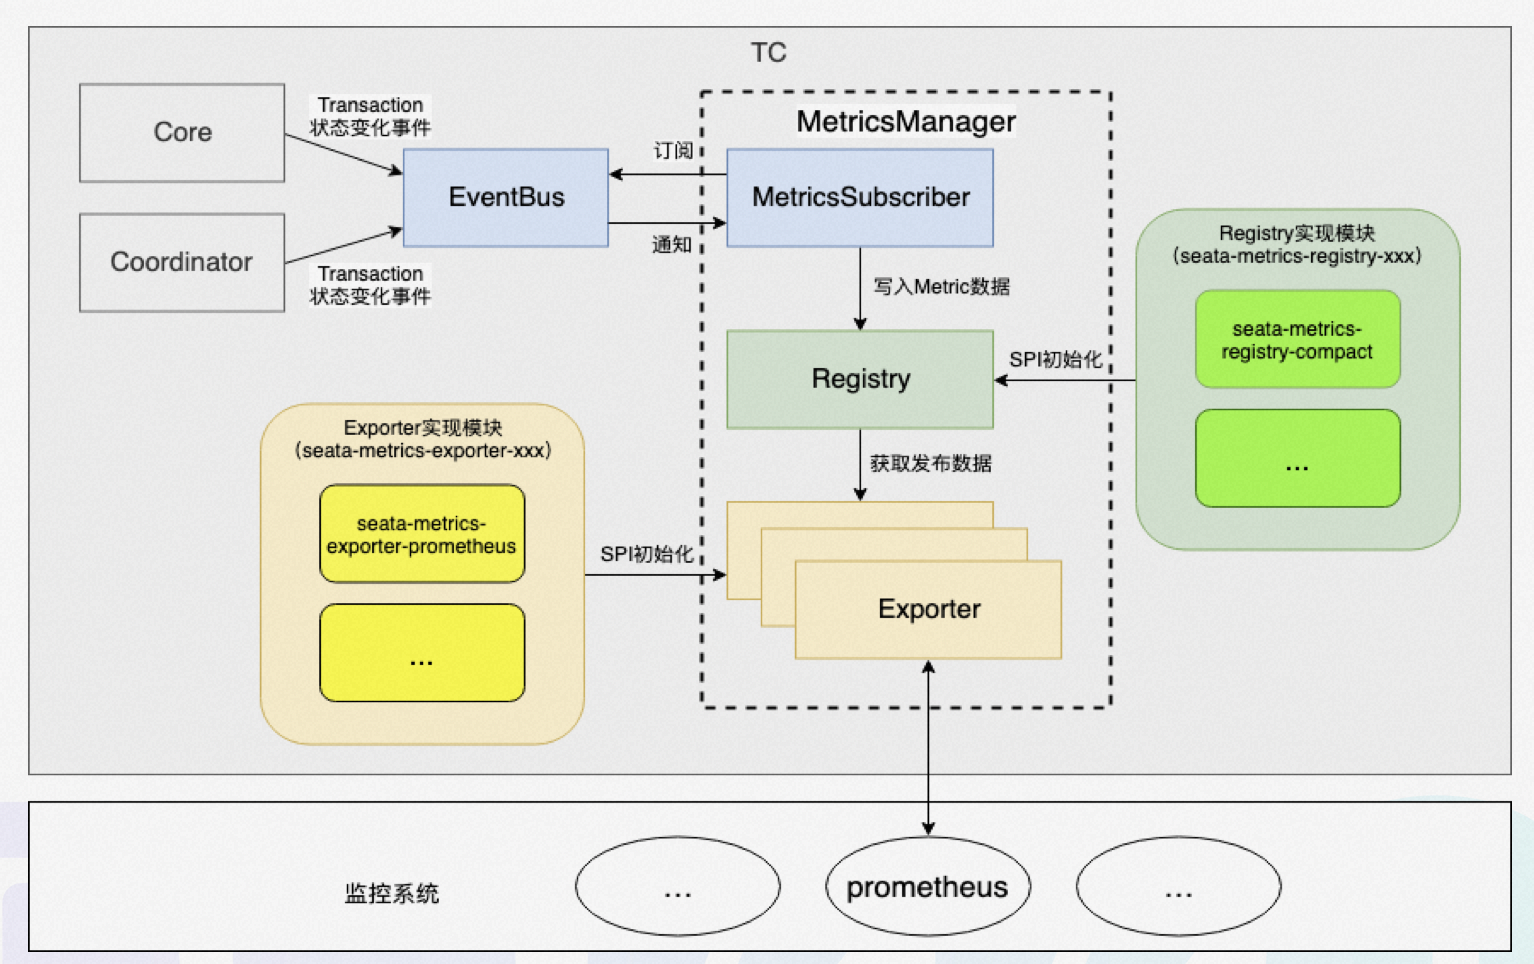 The above figure shows the workflow of the metrics module, which works as follows:
- load Exporter and Registry implementation classes based on configuration using SPI mechanism;
- based on the message subscription and notification mechanism, listen for state change events for all global transactions and publish to EventBus;
- event subscribers consume events and write the generated metrics to Registry;
- the monitoring system (e.g. prometheus) pulls data from the Exporter.
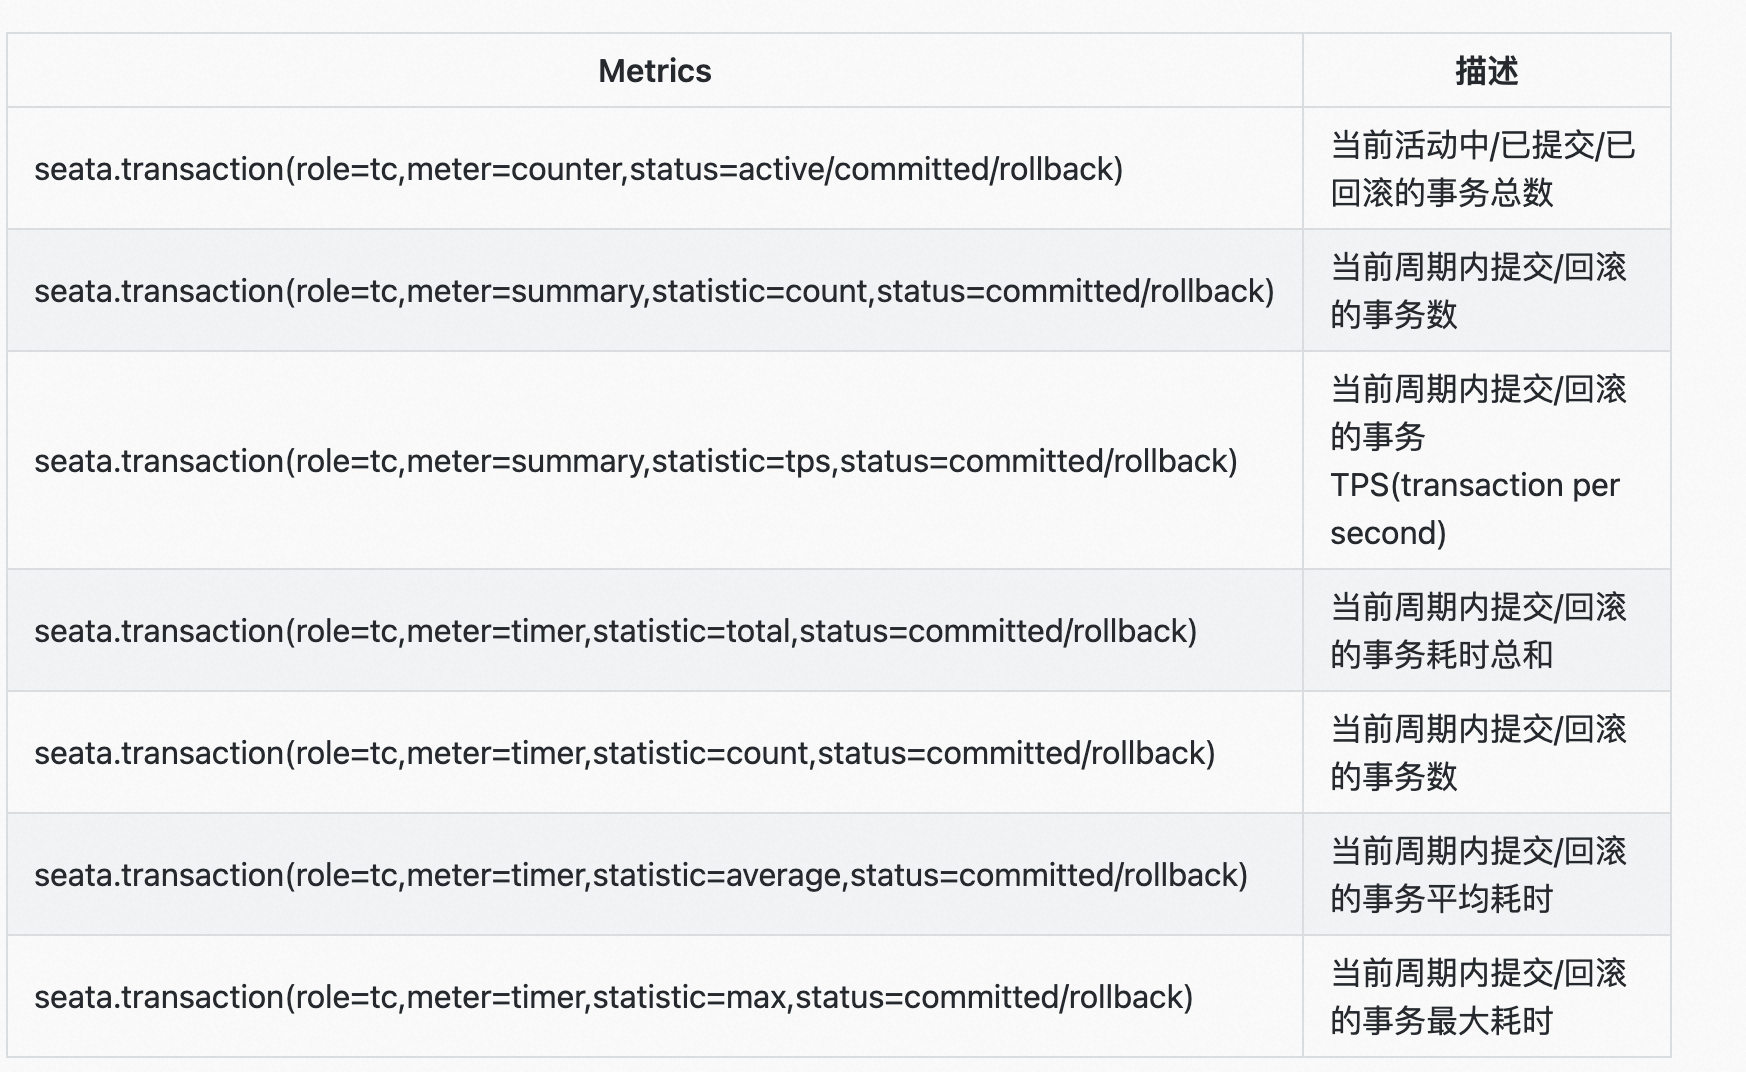
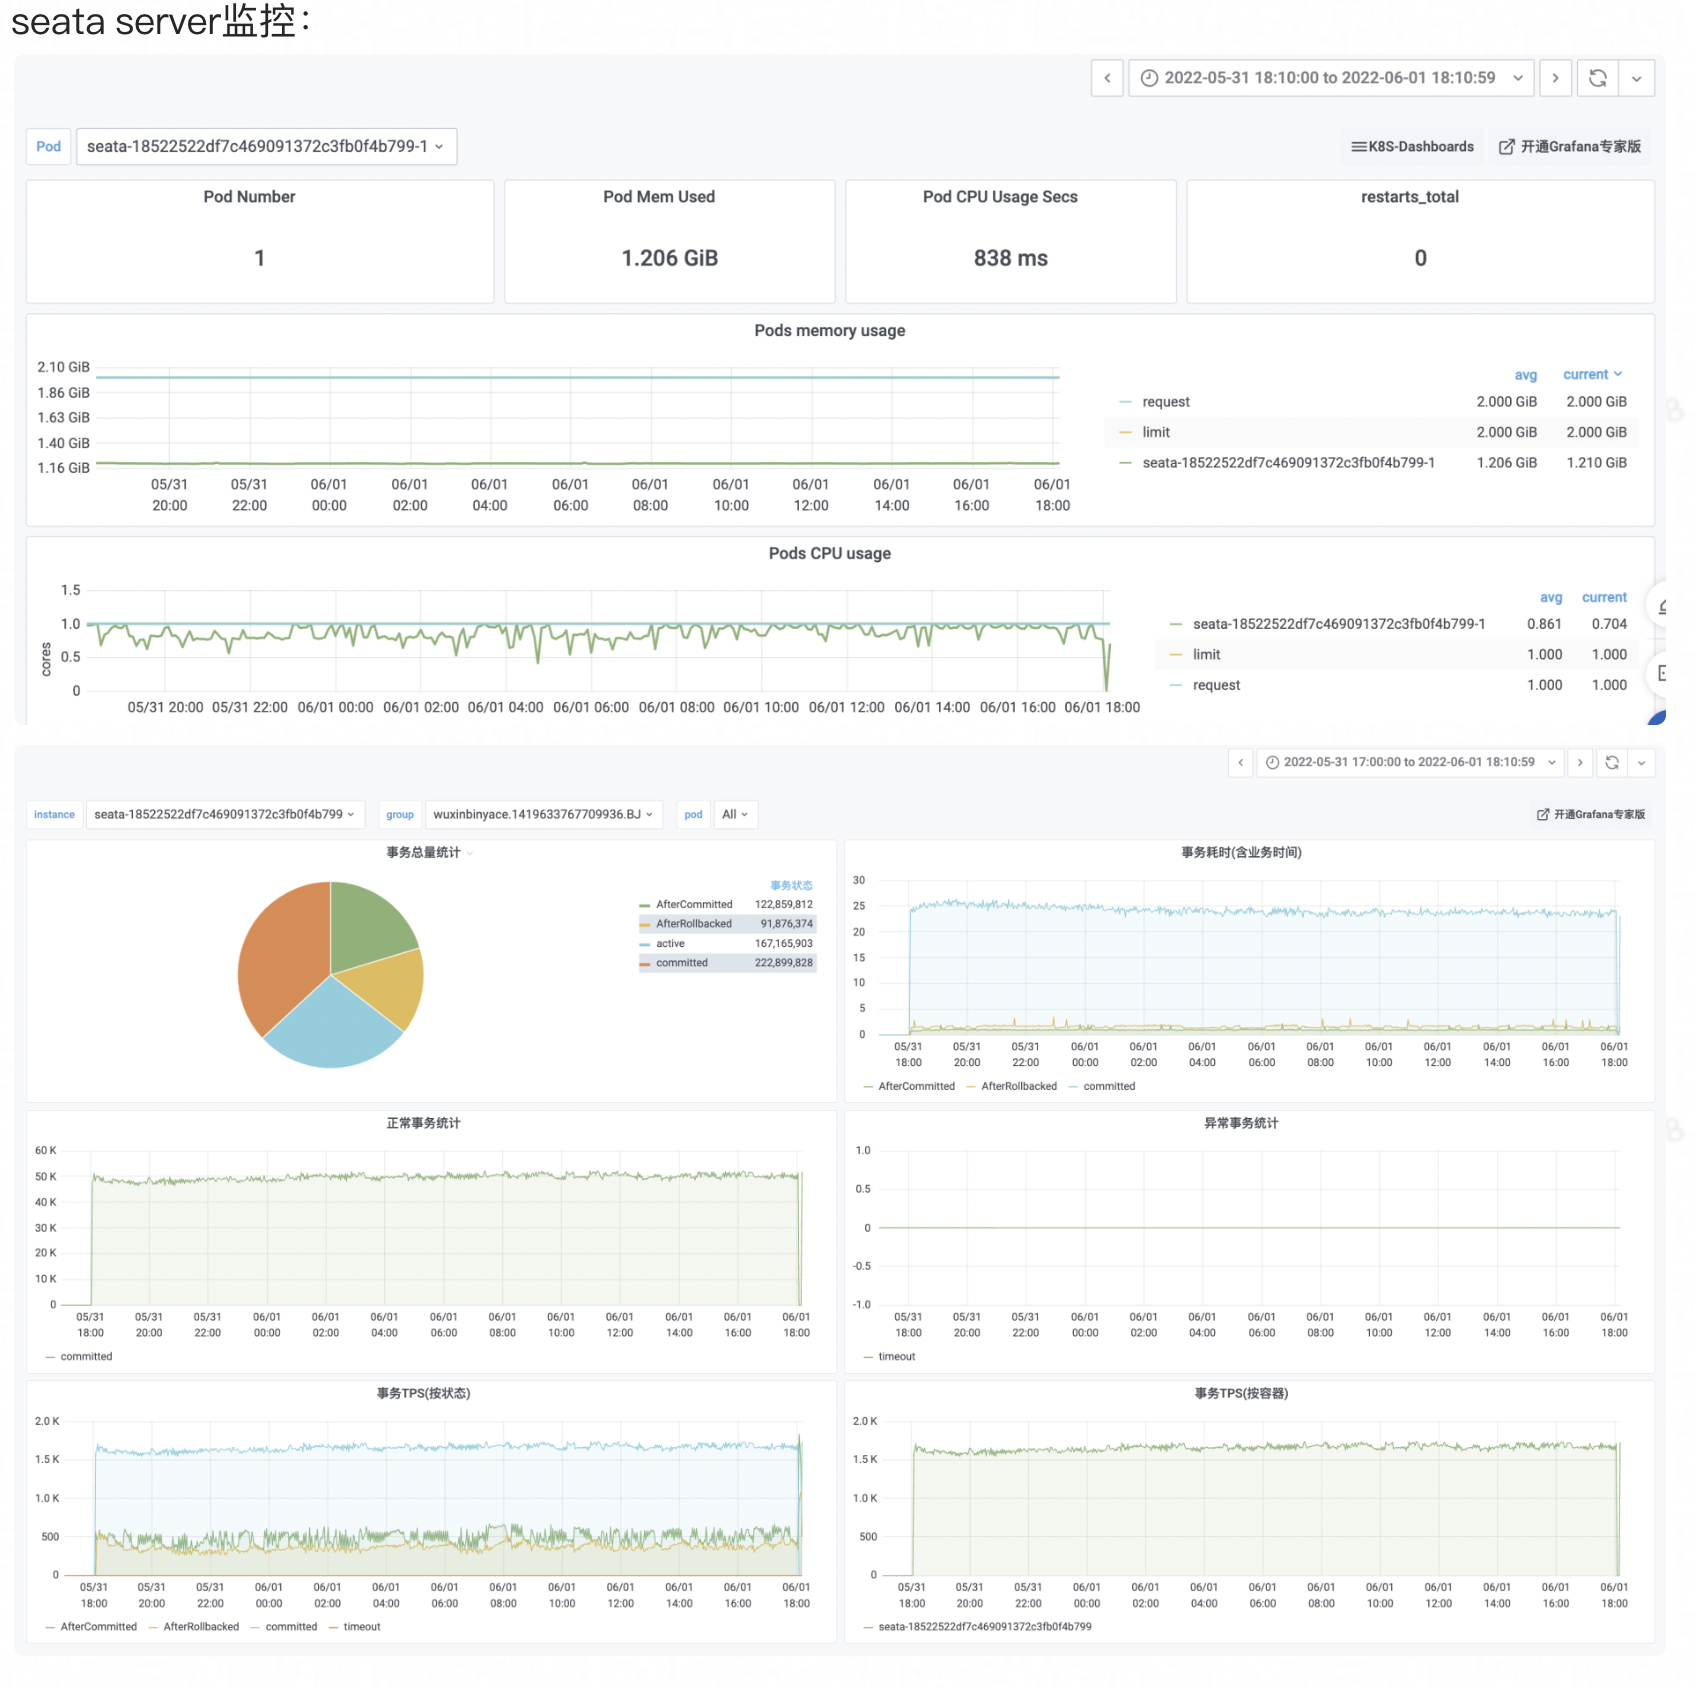
TC Core Metrics
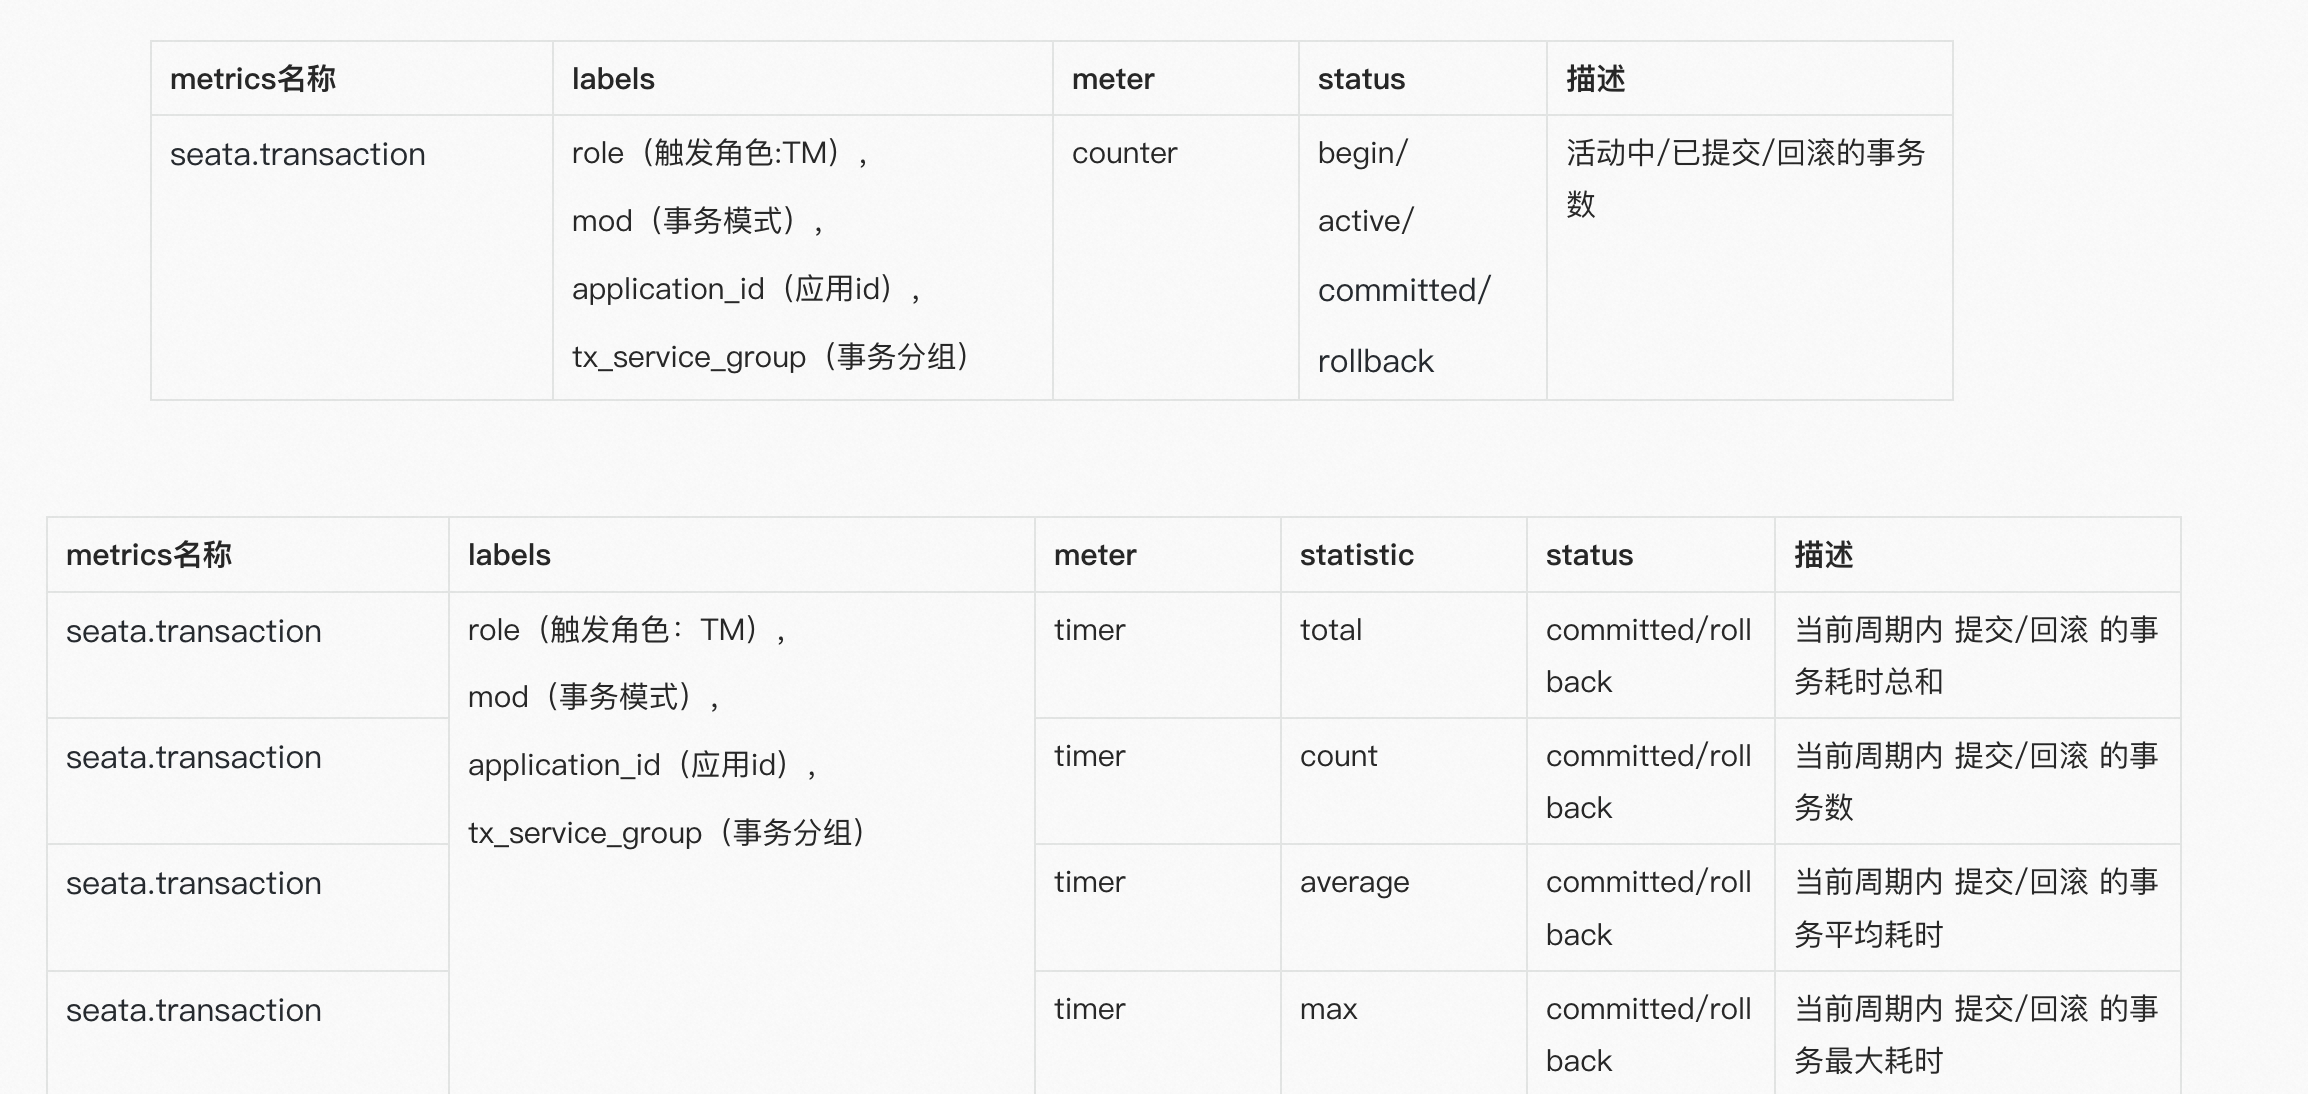
TM Core Metrics
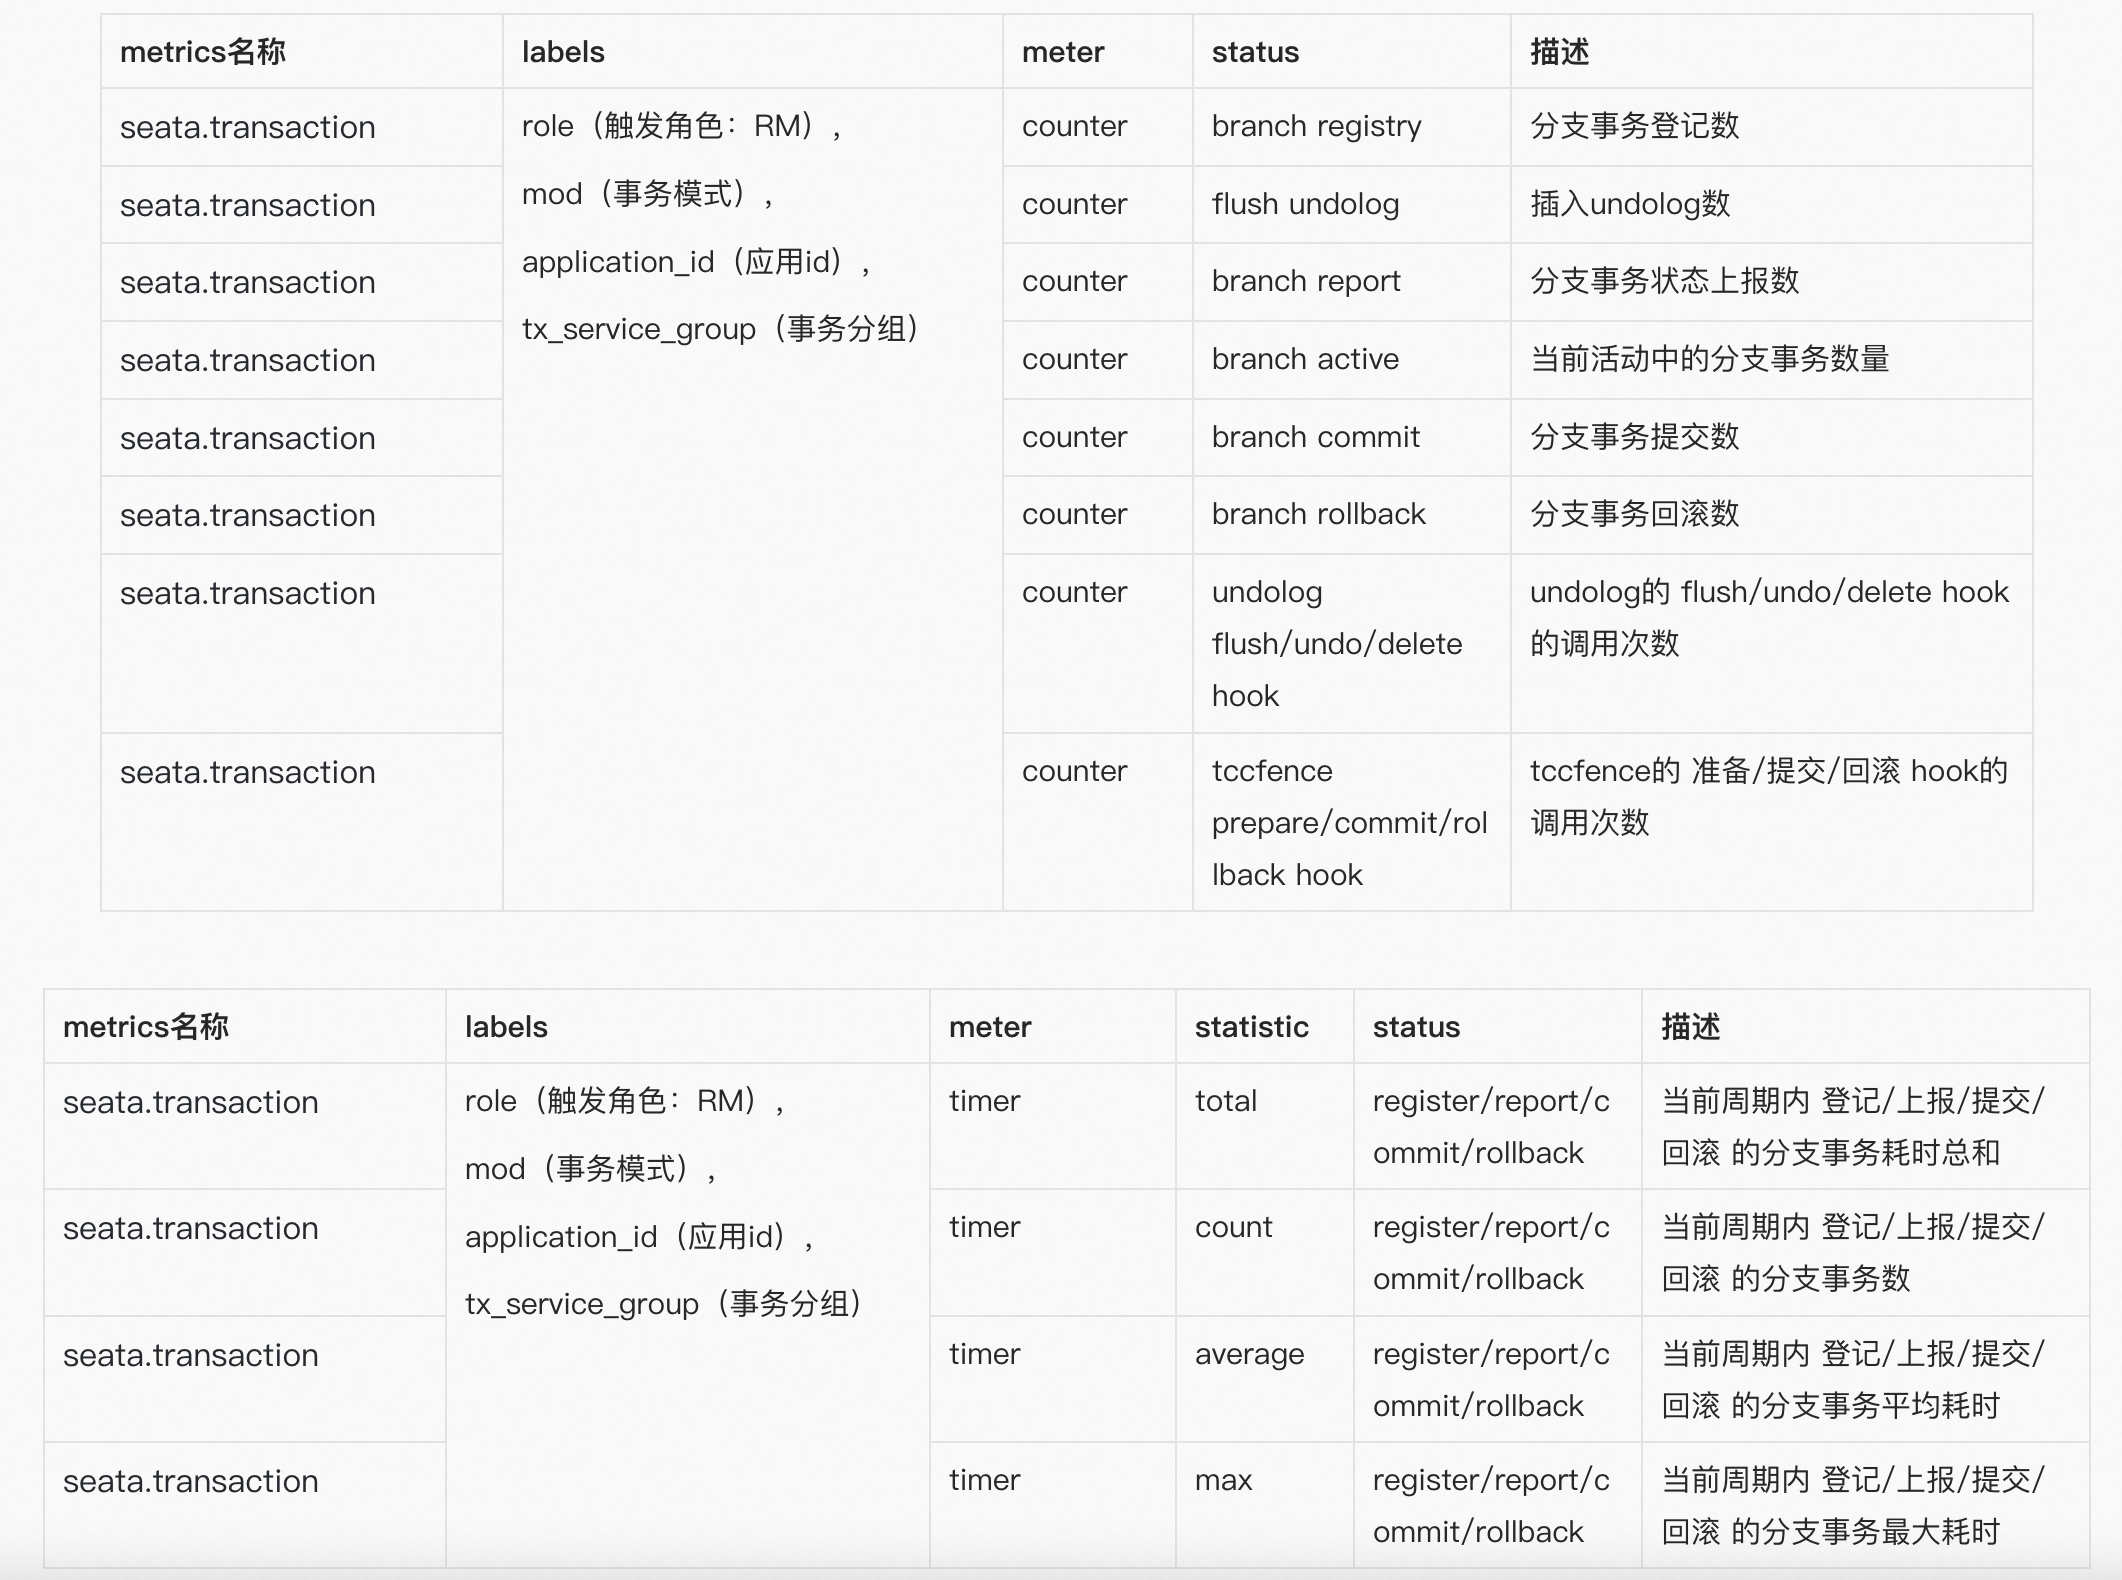
RM Core Metrics
Large Cap Showcase
Tracing dimensions
Why does Seata need tracing?��
- for the business side, how much of a drain on business performance will the introduction of Seata cause? Where is the main time consumption? How to optimise the business logic? These are all unknown.
- All the message records of Seata are persisted through the log to fall the disc, but the log is very unfriendly to users who do not understand Seata. Can we improve the efficiency of transaction link scheduling by accessing Tracing?
- for novice users, can through Tracing records, quickly understand the working principle of seata, reduce the threshold of seata use.
Seata's tracing solution
- Seata defines Header information in a custom RPC message protocol;
- SkyWalking intercepts the specified RPC message and injects tracing related span information;
- The lifecycle scope of the span is defined with the RPC message sending & receiving as the threshold.
Based on the above approach, Seata implements transaction-wide tracing, please refer to Accessing Skywalking for [Seata application | Seata-server] for specific access.
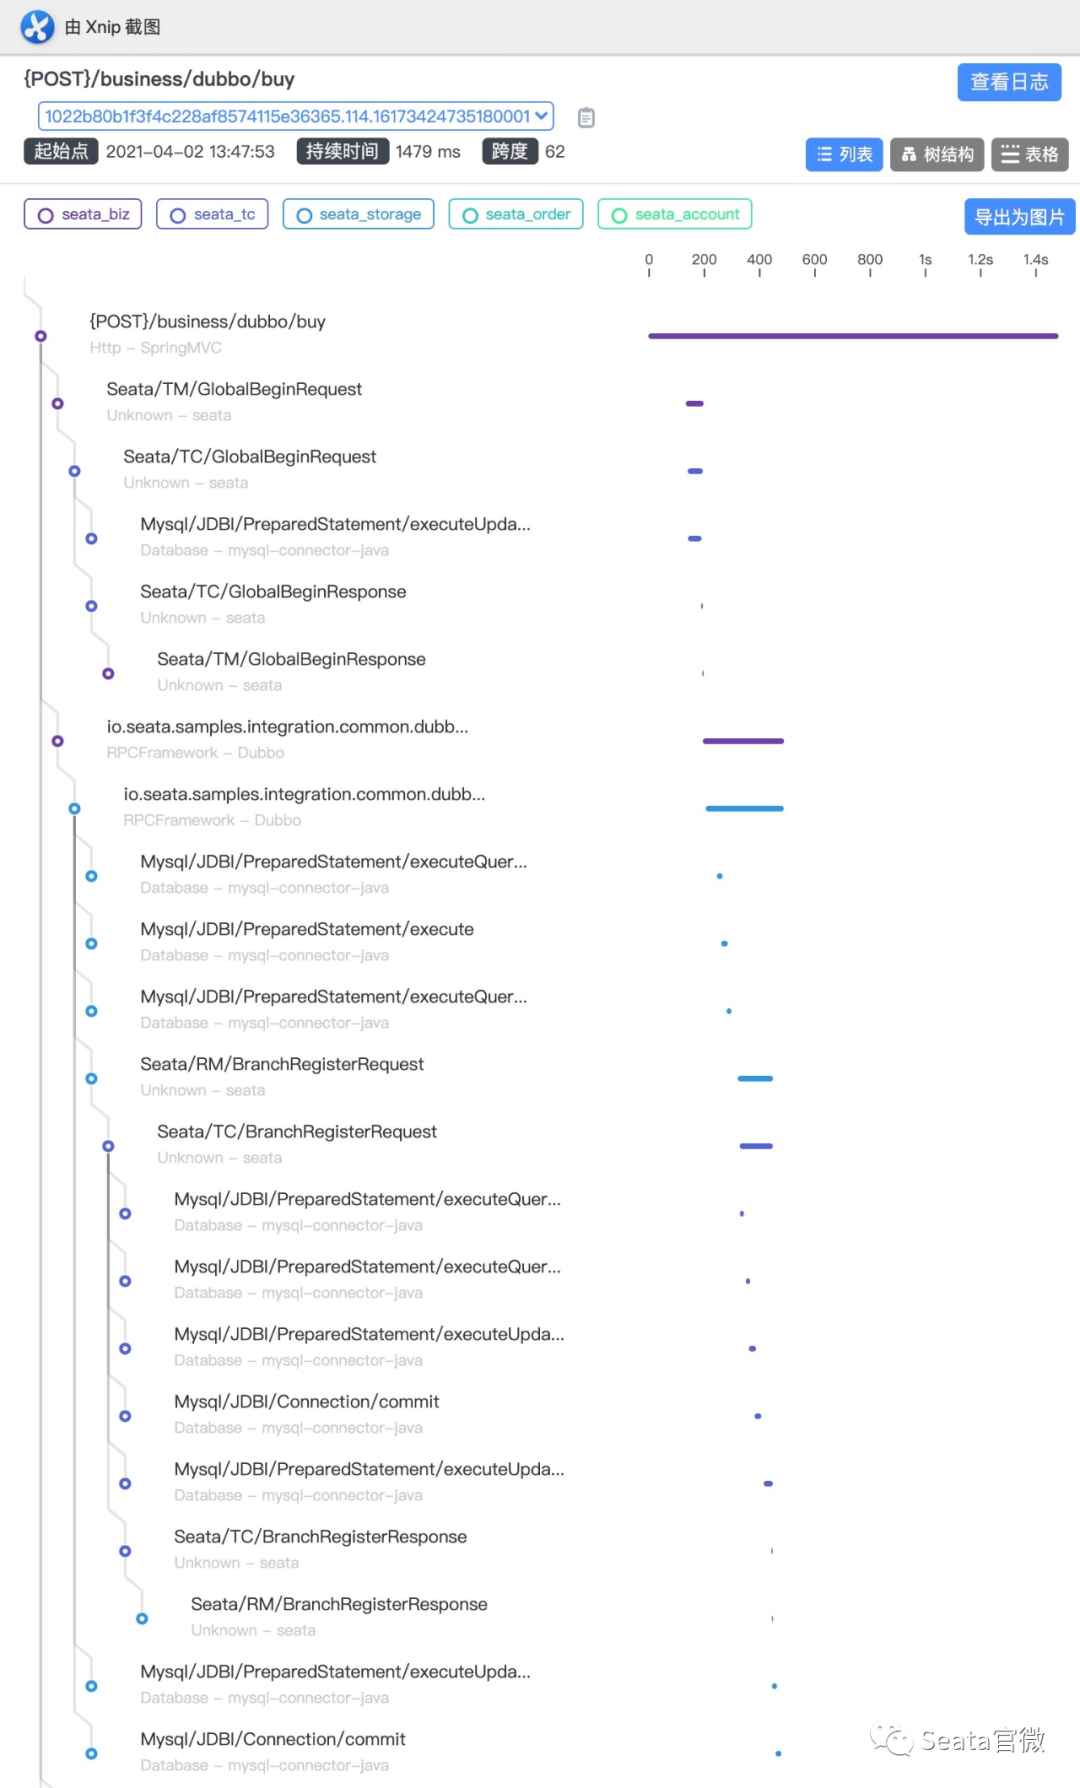
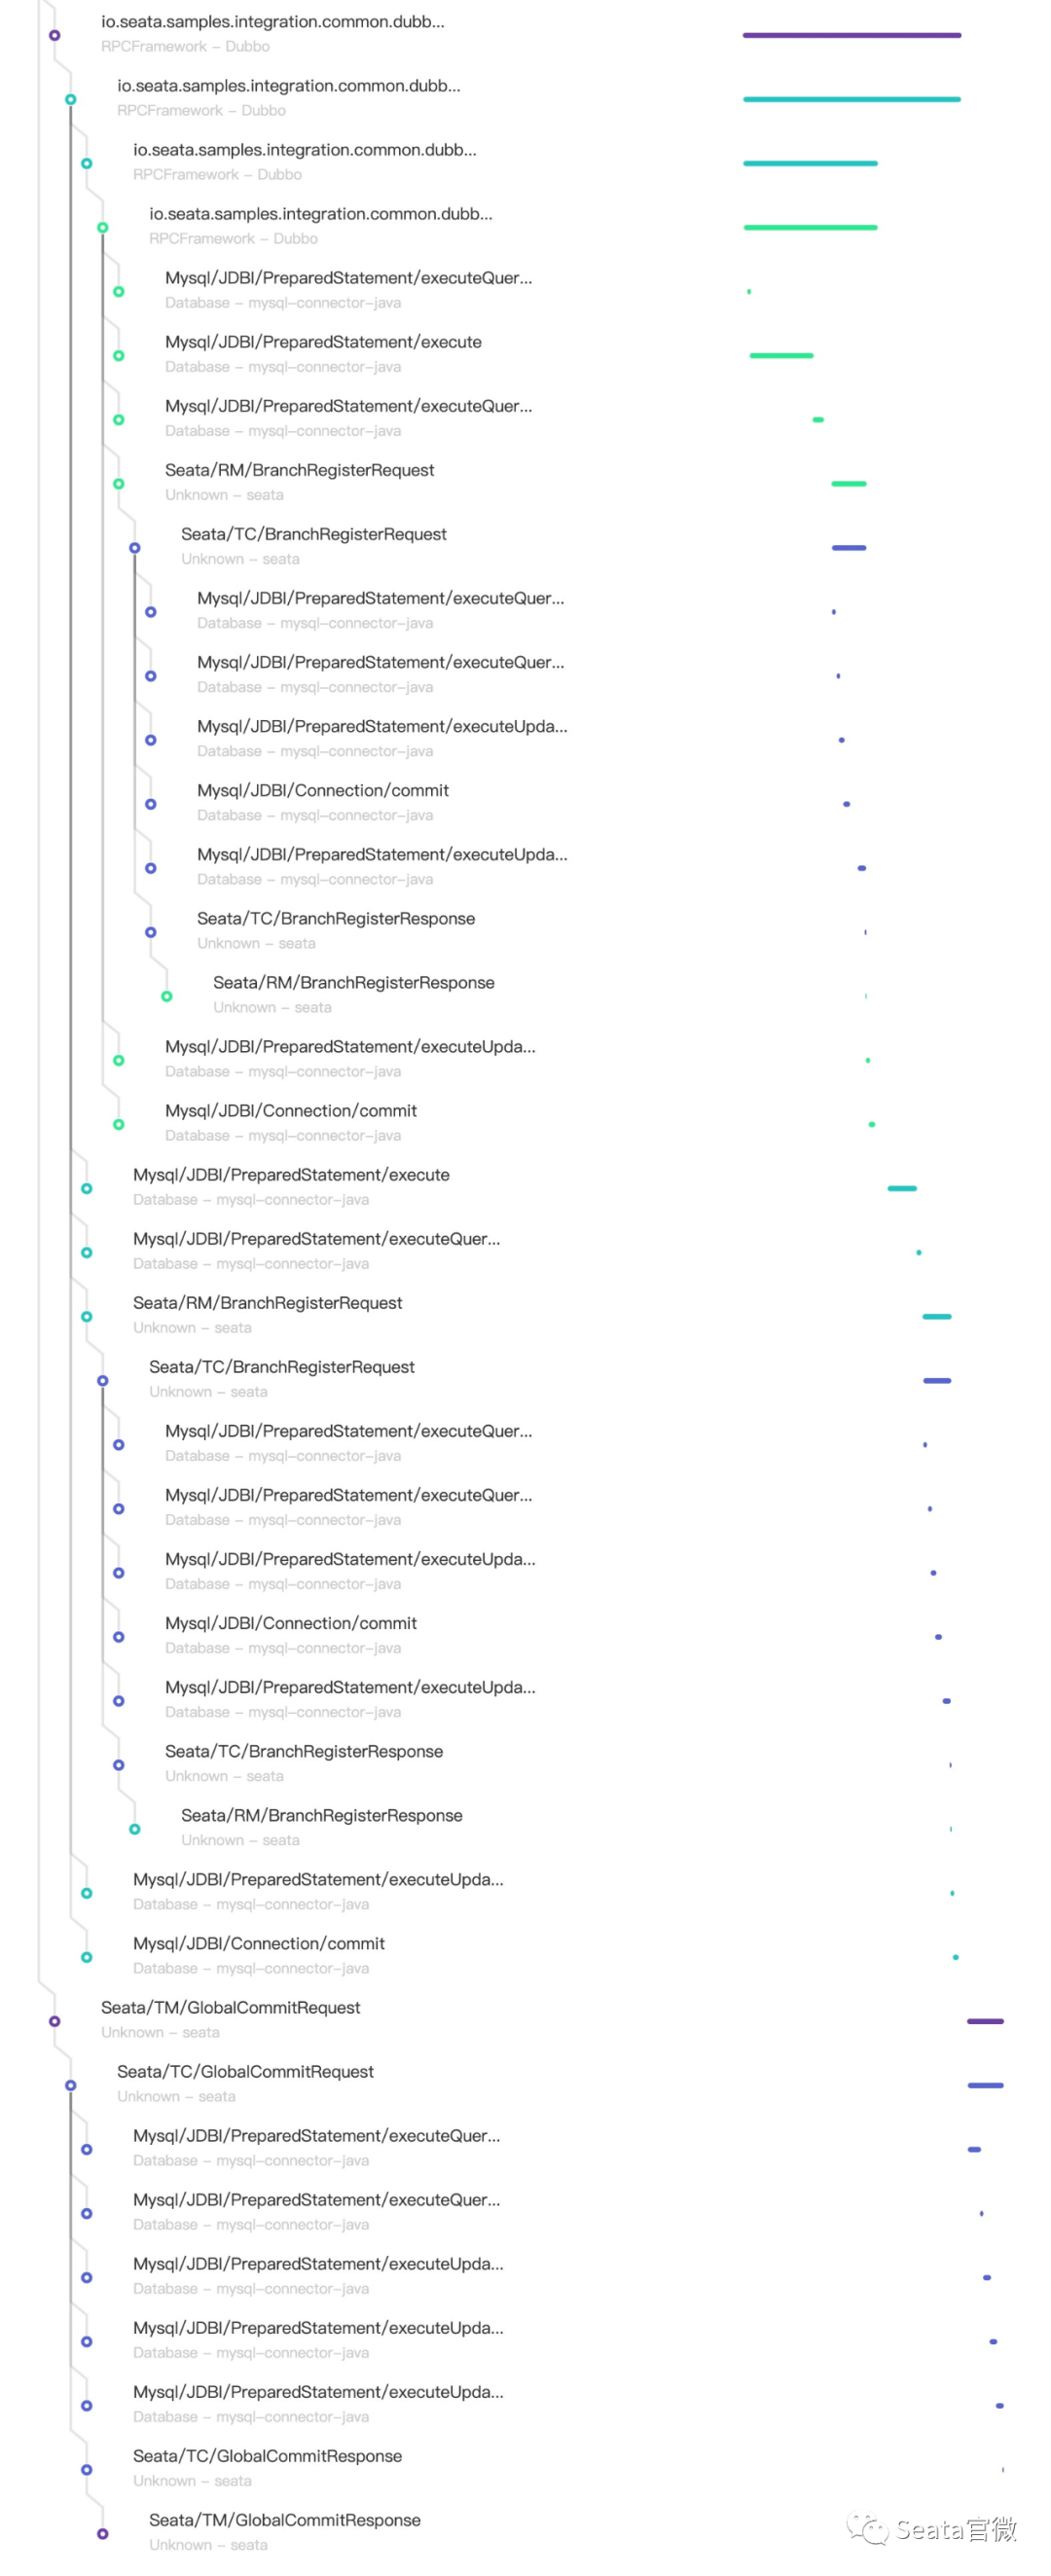
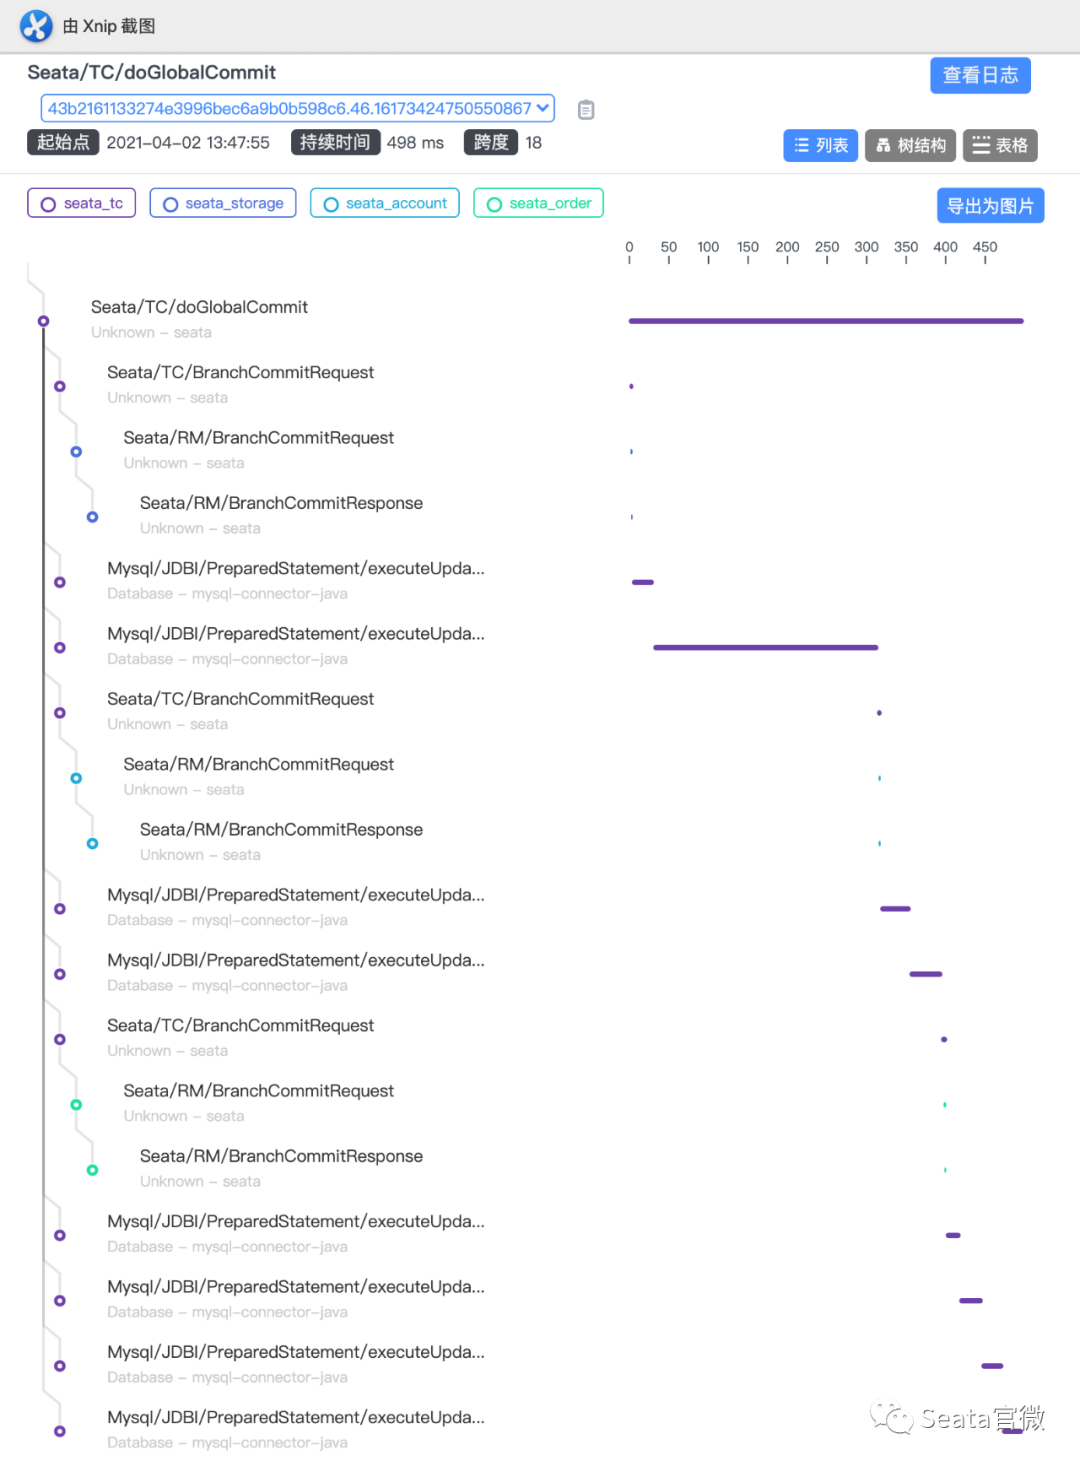
tracing effects
- Based on the demo scenario:
- user requests transaction service
- transaction service locks inventory
- the transaction service creates a bill
- The billing service performs a debit
- Transaction link for GlobalCommit success (example)
Logging dimension
Design Ideas
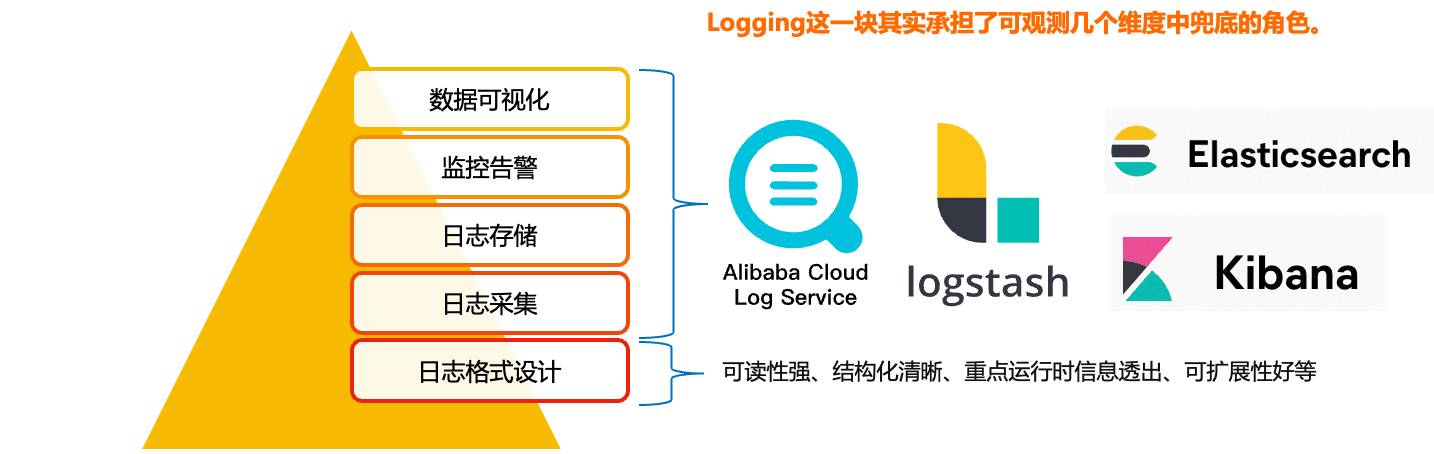 Logging is the bottom of the observable dimensions. Placed at the bottom, in fact, is the design of our log format, only a good log format, we can make it a better collection, modular storage and display. On top of it, is the log collection, storage, monitoring, alarms, data visualisation, these modules are more ready-made tools, such as Ali's SLS logging service, and ELK's set of technology stack, we are more overhead costs, access complexity, ecological prosperity, etc. as a consideration.
Log format design
Here we take a log format of Seata-Server as a case study:
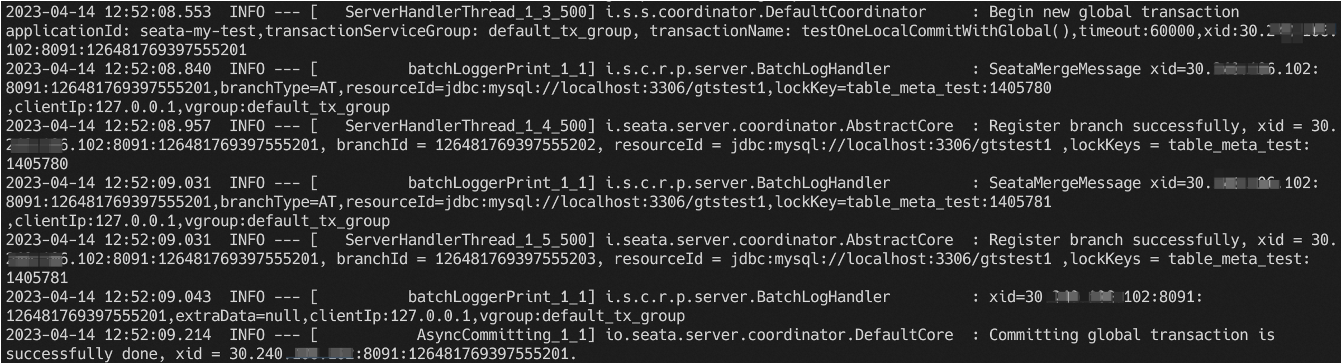
- Thread pool canonical naming: When there are more thread pools and threads, canonical thread naming can clearly show the execution order of the threads that are executed in an unordered way.
- Traceability of method class names: Quickly locate specific code blocks.
- Key Runtime Information Transparency: Focus on highlighting key logs and not printing non-critical logs to reduce log redundancy.
- Extensible message format: Reduce the amount of code modification by extending the output format of the message class.
Summary & Outlook
Metrics
Summary: basically achieve quantifiable and observable distributed transactions. Prospect: more granular metrics, broader ecological compatibility.
Tracing
Summary: Traceability of the whole chain of distributed transactions. Prospect: trace transaction links according to xid, and quickly locate the root cause of abnormal links.
Logging
Summary: Structured log format. Prospect: Evolution of log observable system.